Use cases
This section presents scenarios that are enabled by the existence of a standard vocabulary for the representation of statistics as Linked Data.
SDMX Web Dissemination Use Case
(Use case taken from SDMX Web Dissemination Use Case [SDMX 2.1])
Since we have adopted the multidimensional model that underlies SDMX, we also adopt the "Web Dissemination Use Case" which is the prime use case for SDMX since it is an increasingly popular use of SDMX and enables organizations to build a self-updating dissemination system.
The Web Dissemination Use Case contains three actors, a structural metadata Web service (registry) that collects metadata about statistical data in a registration fashion, a data Web service (publisher) that publishes statistical data and its metadata as registered in the structural metadata Web service, and a data consumption application (consumer) that first discovers data from the registry, then queries data from the corresponding publisher of selected data, and then visualizes the data.
Benefits
- A structural metadata source (registry) can collect metadata about statistical data.
- A data Web service (publisher) can register statistical data in a registry, and can provide statistical data from a database and metadata from a metadata repository for consumers. For that, the publisher creates database tables, and loads statistical data in a database and metadata in a metadata repository.
- A consumer can discover data from a registry and automatically can create a query to the publisher for selected statistical data.
- The publisher can translate the query to a query to its database as well as metadata repository and return the statistical data and metadata.
- The consumer can visualize the returned statistical data and metadata.
Challenges
- This use case is too abstract. The SDMX Web Dissemination Use Case can be concretized by several sub-use cases, detailed in the following sections.
- In particular, this use case requires a recommended way to advertise published statistical datasets, which supports the following lesson: Publishers may need guidance in communicating the availability of published statistical data to external parties and to allow automatic discovery of statistical data.
Publisher Case Study: UK government financial data from Combined Online Information System (COINS)
(This use case has been summarized from Ian Dickinson et al. [COINS])
More and more organizations want to publish statistics on the Web, for reasons such as increasing transparency and trust. Although, in the ideal case, published data can be understood by both humans and machines, data often is simply published as CSV, PDF, XSL etc., lacking elaborate metadata, which makes free usage and analysis difficult.
Therefore, the goal in this scenario is to use a machine-readable and application-independent description of common statistics, expressed using open standards, to foster usage and innovation on the published data. In the "COINS as Linked Data" project [COINS], the Combined Online Information System (COINS) shall be published using a standard Linked Data vocabulary. Via the Combined Online Information System (COINS), HM Treasury, the principal custodian of financial data for the UK government, releases previously restricted financial information about government spending.
The COINS data has a hypercube structure. It describes financial transactions using seven independent dimensions (time, data-type, department etc.) and one dependent measure (value). Also, it allows thirty-three attributes that may further describe each transaction. COINS is an example of one of the more complex statistical datasets being publishing via data.gov.uk.
Part of the complexity of COINS arises from the nature of the data being released:
The published COINS datasets cover expenditure related to five different years (2005–06 to 2009–10). The actual COINS database at HM Treasury is updated daily. In principle at least, multiple snapshots of the COINS data could be released throughout the year.
The actual data and its hypercube structure are to be represented separately so that an application first can examine the structure before deciding to download the actual data, i.e., the transactions. The hypercube structure also defines, for each dimension and attribute, a range of permitted values that are to be represented.
An access or query interface to the COINS data, e.g., via a SPARQL endpoint or the linked data API, is planned. Queries that are expected to be interesting are: "spending for one department", "total spending by department", "retrieving all data for a given observation" etc.
Benefits
According to the COINS as Linked Data project, the reason for publishing COINS as Linked Data are threefold:
- using an open standard representation makes it easier to work with the data using available technologies and promises innovative third-party tools and usages;
- individual transactions and groups of transactions are given an identity, and so can be referenced by Web address (URL), to allow them to be discussed, annotated, or listed as source data for articles or visualizations;
- cross-links between linked-data datasets allow for much richer exploration of related datasets.
Challenges
The COINS use case leads to the following challenges:
- Although not originally intended, the Data Cube Vocabulary could be successfully used for publishing financial data, not just statistics. This has also been shown by the Payments Ontology.
- Also, the publisher favors a representation that is both as self-descriptive as possible, i.e., others can link to and download fully-described individual transactions, and as compact as possible, i.e., information is not unnecessarily repeated. This challenge supports lesson: Publishers and consumers may need guidance in checking and making use of well-formedness of published data using data cube.
- Moreover, the publisher is thinking about the possible benefit of publishing slices of the data, e.g., datasets that fix all dimensions but the time dimension. For instance, such slices could be particularly interesting for visualizations or comments. However, depending on the number of dimensions, the number of possible slices can become large which makes it difficult to semi-automatically select all interesting slices. This challenge supports lesson: Publishers may need more guidance in creating and managing slices or arbitrary groups of observations.
- An important benefit of linked data is that we are able to annotate data, at a fine-grained level of detail, to record information about the data itself. This includes where it came from — the provenance of the data — but could include annotations from reviewers, links to other useful resources, etc. Being able to trust that data to be correct and reliable is a central value for government-published data, so recording provenance is a key requirement for the COINS data. For instance, the COINS project [COINS] has at least four perspectives on what they mean by “COINS” data: the abstract notion of “all of COINS”; the data for a particular year; the version of the data for a particular year released on a given date; and the constituent graphs which hold both the authoritative data translated from HMT’s own sources and additional supplementary information which they derive from the data, for example by cross-linking to other datasets. This challenge supports lesson: Publishers may need guidance in making transparent the pre-processing of aggregate statistics.
- A challenge also is the size of the data, especially since it is updated regularly. Five data files already contain between 3.3 and 4.9 million rows of data. This challenge supports lesson: Publishers and consumers may need more guidance in efficiently processing data using the Data Cube Vocabulary.
Publisher Use Case: Publishing Excel Spreadsheets about Dutch historical census data as Linked Data
(This use case has been contributed by Rinke Hoekstra. See CEDA_R and Data2Semantics for more information.)
Not only in government, there is a need to publish considerable amounts of statistical data to be consumed in various (also unexpected) application scenarios. Typically, Microsoft Excel sheets are made available for download.
For instance, in the CEDA_R and Data2Semantics projects publishing and harmonizing Dutch historical census data (from 1795 onwards) is a goal. These censuses are now only available as Excel spreadsheets (obtained by data entry) that closely mimic the way in which the data was originally published and shall be published as Linked Data.
Those Excel sheets contain single spreadsheets with several multidimensional data tables, having a name and notes, as well as column values, row values, and cell values.
Another concrete example is the Stats2RDF project that intends to publish Excel sheets with biomedical statistical data. Here, Excel files are first translated into CSV and then translated into RDF using OntoWiki, a semantic wiki.
Benefits
- The goal in this use case is to publish spreadsheet information in a machine-readable format on the Web, e.g., so that crawlers can find spreadsheets that use a certain column value. The published data should represent and make available for queries the most important information in the spreadsheets, e.g., rows, columns, and cell values.
- All context and so all meaning of the measurement point is expressed by means of dimensions. The pure number is the star of an ego-network of attributes or dimensions. In an RDF representation it is then easily possible to define hierarchical relationships between the dimensions (that can be exemplified further) as well as mapping different attributes across different value points. This way a harmonization among variables is performed around the measurement points themselves.
- Integration with provenance vocabularies, e.g., PROV-O, for tracking of harmonization steps becomes possible.
- Once data representation and publication are standardised, consumers can focus on novel visualizations and analysis interfaces of census data.
- In historical research, until now, harmonization across datasets is performed by hand, and in subsequent iterations of a database: it is very hard to trace back the provenance of decisions made during the harmonization procedure. Publishing the census data as Linked Data may allow (semi-)automatic harmonization.
Challenges
- Semi-structured information, e.g., notes about lineage of data cells, may not be possible to be formalized. This supports lesson Publishers may need guidance in making transparent the pre-processing of aggregate statistics.
- Combining Data Cube with SKOS [SKOS] to allow for cross-location and cross-time historical analysis, supporting lesson Publishers may need more guidance to decide which representation of hierarchies is most suitable for their use case.
- These challenges may seem to be particular to the field of historical research, but in fact apply to government information at large. Government is not a single body that publishes information at a single point in time. Government consists of multiple (altering) bodies, scattered across multiple levels, jurisdictions and areas. Publishing government information in a consistent, integrated manner requires exactly the type of harmonization required in this use case.
- Define a mapping between Excel and the Data Cube Vocabulary. Excel spreadsheets are representative for other common representation formats for statistics such as CSV, XBRL, ARFF, which supports lesson Publishers may need guidance in conversions from common statistical representations such as CSV, Excel, ARFF etc.
- Excel sheets provide a great deal of flexibility in arranging information. It may be necessary to limit this flexibility to allow automatic transformation.
- There may be many spreadsheets which supports lesson Publishers and consumers may need more guidance in efficiently processing data using the Data Cube Vocabulary.
Publisher Use Case: Publishing hierarchically structured data from StatsWales and Open Data Communities
(Use case has been taken from [QB4OLAP] and from discussions at publishing-statistical-data mailing list)
It often comes up in statistical data that you have some kind of 'overall' figure, which is then broken down into parts.
Example (in pseudo-turtle RDF):
ex:obs1
  sdmx:refArea <uk>;
  sdmx:refPeriod "2011";
  ex:population "60" .
ex:obs2
  sdmx:refArea <england>;
  sdmx:refPeriod "2011";
  ex:population "50" .
ex:obs3
  sdmx:refArea <scotland>;
  sdmx:refPeriod "2011";
  ex:population "5" .
ex:obs4
  sdmx:refArea <wales>;
  sdmx:refPeriod "2011";
  ex:population "3" .
ex:obs5
  sdmx:refArea <northernireland>;
  sdmx:refPeriod "2011";
  ex:population "2" .
We are looking for the best way (in the context of the RDF/Data
Cube/SDMX approach) to express that the values for
England, Scotland, Wales & Northern Ireland ought to add up to the value
for the UK and constitute a more detailed breakdown of the overall UK
figure. Since we might also have population figures for France,
Germany, EU28 etc., it is not as simple as just taking a
qb:Slice where you fix the time period and the measure.
Similarly, Etcheverry and Vaisman [QB4OLAP] present the use case to publish household data from StatsWales and Open Data Communities.
This multidimensional data contains for each fact a time dimension with one level Year and a location dimension with levels Unitary Authority, Government Office Region, Country, and ALL. As unit, units of 1000 households is used.
In this use case, one wants to publish not only a dataset on the bottom most level, i.e., what are the number of households at each Unitary Authority in each year, but also a dataset on more aggregated levels. For instance, in order to publish a dataset with the number of households at each Government Office Region per year, one needs to aggregate the measure of each fact having the same Government Office Region using the SUM function.
Similarly, for many uses then population broken down by some category (e.g., ethnicity) is expressed as a percentage. Separate datasets give the actual counts per category and aggregate counts. In such cases it is common to talk about the denominator (often DENOM) which is the aggregate count against which the percentages can be interpreted.
Benefits
- Expressing aggregation relationships would allow query engines to automatically derive statistics on higher aggregation levels.
- Vice versa, representing further aggregated datasets would allow the answering of queries with a simple lookup instead of computations which may be more time consuming or require specific features of the query engine (e.g., SPARQL 1.1).
Challenges
- Importantly, one would like to maintain the relationship between the resulting datasets, i.e., the levels and aggregation functions. Again, this use case does not simply need a selection (or "dice" in OLAP context) where one fixes the time period dimension, but includes aggregation. This supports lesson Publishers may need guidance in how to represent common analytical operations such as Slice, Dice, Rollup on data cubes
- Literals that are used in observations cannot be used as subjects in triples. So no hierarchies can be defined that would, for example, link integer years via skos:narrower to months. This supports lesson Publishers may need more guidance to decide which representation of hierarchies is most suitable for their use case.
Publisher Case Study: Publishing Observational Data Sets about UK Bathing Water Quality
(Use case has been provided by Epimorphics Ltd, in their UK Bathing Water Quality deployment)
As part of their work with data.gov.uk and the UK Location Programme, Epimorphics Ltd have been working to pilot the publication of both current and historic bathing water quality information from the UK Environment Agency as Linked Data.
The UK has a number of areas, typically beaches, that are designated as bathing waters where people routinely enter the water. The Environment Agency monitors and reports on the quality of the water at these bathing waters.
The Environment Agency's data can be thought of as structured in 3 groups:
- basic reference data describing the bathing waters and sampling points;
- "Annual Compliance Assessment Dataset" giving the rating for each bathing water for each year it has been monitored;
- "In-Season Sample Assessment Dataset" giving the detailed weekly sampling results for each bathing water.
The most important dimensions of the data are bathing water, sampling point, and compliance classification.
Benefits
- The bathing-water dataset (documentation) is structured around the use of the Data Cube Vocabulary and fronted by a linked data API configuration which makes the data available for re-use in additional formats such as JSON and CSV.
- Publishing bathing-water quality information in this way will 1) enable the Environment Agency to meet the needs of its many data consumers in a uniform way rather than through diverse pair-wise arrangements 2) preempt requests for specific data and 3) enable a larger community of Web and mobile application developers and value-added information aggregators to use and re-use bathing-water quality information sourced by the environment agency.
Challenges
- Observations may exhibit a number of attributes, e.g., whether there was an abnormal weather exception.
- Relevant slices of both datasets are to be created, which
supports lesson Publishers
may need more guidance in creating and managing slices or arbitrary
groups of observations:
- Annual Compliance Assessment Dataset: all the observations for a specific sampling point, all the observations for a specific year.
- In-Season Sample Assessment Dataset: samples for a given sampling point, samples for a given week, samples for a given year, samples for a given year and sampling point, latest samples for each sampling point.
- The use case suggests more arbitrary subsets of the observations, e.g., collecting all the "latest" observations in a continuously updated data set.
- In this use case, observation and measurement data is to be published which per se is not aggregated statistics. The Semantic Sensor Network ontology (SSN) already provides a way to publish sensor information. SSN data provides statistical Linked Data and grounds its data to the domain, e.g., sensors that collect observations (e.g., sensors measuring average of temperature over location and time). Still, this case study has shown that the Data Cube Vocabulary may be a useful alternative and can be successfully used for observation and measurement data, as well as statistical data.
Publisher Case Study: Site specific weather forecasts from Met Office, the UK's National Weather Service
(This section contributed by Dave Reynolds)The Met Office, the UK's National Weather Service, provides a range of weather forecast products including openly available site-specific forecasts for the UK. The site specific forecasts cover over 5000 forecast points, each forecast predicts 10 parameters and spans a 5 day window at 3 hourly intervals, the whole forecast is updated each hour. A proof of concept project investigated the challenge of publishing this information as linked data using the Data Cube vocabulary.
Benefits
- Explicit metadata describing the forecast process, coverage and phenomena being forecast; making the data self-describing.
- Linking to other linked data resources (particularly geographic regions and named places associated with the forecast locations) enabling discovery of related data.
- Ability to define slices through the data for convenient consumption by applications.
Challenges
This weather forecasts case study leads to the following challenges:
ISO19156 compatibility
The World Meteorological Organization (WMO) develops and recommends data interchange standard and within that community compatibility with ISO19156 "Geographic information — Observations and measurements" (O&M) is regarded as important. Thus, this supports lesson Modelers using ISO19156 - Observations & Measurements may need clarification regarding the relationship to the Data Cube Vocabulary.
Solution in this case study:O&M provides a data model for an Observation with associated Phenomenon, measurement ProcessUsed, Domain (feature of interest) and Result. Prototype vocabularies developed at CSIRO and extended within this project allow this data model to be represented in RDF. For the site specific forecasts then a 5-day forecast for all 5000+ sites is regarded as a single O&M Observation.
To represent the forecast data itself, the Result in the O&M model, then the relevant standard is ISO19123 "Geographic information — Schema for coverage geometry and functions". This provides a data model for a Coverage which can represent a set of values across some space. It defines different types of Coverage including a DiscretePointCoverage suited to representing site-specific forecast results.
It turns out that it is straightforward to treat an RDF Data Cube as a particular concrete representation of the DiscretePointCoverage logical model. The cube has dimensions corresponding to the forecast time and location and the measure is a record representing the forecast values of the 10 phenomena. Slices by time and location provide subsets of the data that directly match the data packages supported by an existing on-line service.
Note that in this situation an observation in the sense of
qb:Observation
and an observation in the sense of ISO19156 Observations and
Measurements are different things. The O&M Observation is the
whole forecast whereas each
qb:Observation
corresponds to a single GeometryValuePair within the forecast results
Coverage.
Data volume
Each hourly update comprises over 2 million data points and forecast data is requested by a large number of data consumers. Bandwidth costs are thus a key consideration and the apparent verbosity of RDF in general, and Data Cube specifically, was a concern. This supports lesson Publishers and consumers may need more guidance in efficiently processing data using the Data Cube Vocabulary.
Solution in this case study:Regarding bandwidth costs then the key is not raw data volume but compressibility, since such data is transmitted in compressed form. A Turtle representation of a non-abbreviated data cube compressed to within 15-20% of the size of compressed, handcrafted XML and JSON representations. Thus obviating the need for abbreviations or custom serialization.
Publisher Case Study: Eurostat SDMX as Linked Data
(This use case has been taken from Eurostat Linked Data Wrapper and Linked Statistics Eurostat Data, both deployments for publishing Eurostat SDMX as Linked Data using the draft version of the Data Cube Vocabulary)
As mentioned already, the ISO standard for exchanging and sharing statistical data and metadata among organizations is Statistical Data and Metadata eXchange [SDMX]. Since this standard has proven applicable in many contexts, we adopt the multidimensional model that underlies SDMX and intend the standard vocabulary to be compatible to SDMX. Therefore, in this use case we explain the benefit and challenges of publishing SDMX data as Linked Data.
As one of the main adopters of SDMX, Eurostat publishes large amounts of European statistics coming from a data warehouse as SDMX and other formats on the Web. Eurostat also provides an interface to browse and explore the datasets. However, linking such multidimensional data to related data sets and concepts would require downloading of interesting datasets and manual integration. The goal here is to improve integration with other datasets; Eurostat data should be published on the Web in a machine-readable format, possibly to be linked with other datasets, and possibly to be freely consumed by applications. Both Eurostat Linked Data Wrapper and Linked Statistics Eurostat Data intend to publish Eurostat SDMX data as 5 Star Linked Open Data. Eurostat data is partly published as SDMX, partly as tabular data (TSV, similar to CSV). Eurostat provides a TOC of published datasets as well as a feed of modified and new datasets. Eurostat provides a list of used code lists, i.e., range of permitted dimension values. Any Eurostat dataset contains a varying set of dimensions (e.g., date, geo, obs_status, sex, unit) as well as measures (generic value, content is specified by dataset, e.g., GDP per capita in PPS, Total population, Employment rate by sex).
Benefits
- Possible implementation of ETL pipelines based on Linked Data technologies (e.g., LDSpider) to effectively load the data into a data warehouse for analysis.
- Allows useful queries to the data, e.g., comparison of statistical indicators across EU countries.
- Allows one to attach contextual information to statistics during the interpretation process.
- Allows one to reuse single observations from the data.
- Linking to information from other data sources, e.g., for geo-spatial dimension.
Challenges
- There is a large number of Eurostat datasets, each possibly containing a large number of columns (dimensions) and rows (observations). Eurostat publishes more than 5200 datasets, which, when converted into RDF require more than 350GB of disk space yielding a dataspace with some 8 billion triples. This supports lesson Publishers and consumers may need more guidance in efficiently processing data using the Data Cube Vocabulary.
- In the Eurostat Linked Data Wrapper, there is a timeout for transforming SDMX to Linked Data, since Google App Engine is used. Mechanisms to reduce the amount of data that needs to be translated would be needed, again supporting lesson Publishers and consumers may need more guidance in efficiently processing data using the Data Cube Vocabulary.
- Each dimension used by a dataset has a range of permitted values that need to be described.
- The Eurostat SDMX as Linked Data use case provides data on a gender level and on a level aggregating over the gender level. This suggests a need to have time lines on data aggregating over the gender dimension, supporting the lesson: Publishers may need guidance in how to represent common analytical operations such as Slice, Dice, Rollup on data cubes.
- New Eurostat datasets are added regularly to Eurostat. The
Linked Data representation should automatically provide access to the
most-up-to-date data:
- Eurostat Linked Data pulls in changes from the original Eurostat dataset on a weekly basis and the conversion process runs every Saturday at noon taking into account new datasets along with updates to existing datasets.
- Eurostat Linked Data Wrapper translates Eurostat datasets into RDF on the fly so that the most current data is always used. The problem is only to point users towards the URIs of Eurostat datasets: Estatwrap provides a feed of modified and new datasets. Also, it provides a TOC that could be automatically updated from the Eurostat TOC.
- Query interface
- Eurostat Linked Data provides a SPARQL endpoint for the metadata (not the observations).
- Eurostat Linked Data Wrapper provides resolvable URIs to datasets (ds) that return all observations of the dataset. Also, every dataset serves the URI of its data structure definition (dsd). The dsd URI returns all RDF describing the dataset. Separating information resources for dataset and data structure definition allows one, for example, to first gather the dsd and only for actual query execution to resolve the ds.
- Providing a useful interface for browsing and visualizing the
data:
- One problem is that the data sets have too high dimensionality to be displayed directly. Instead, one could visualize slices of time series data. However, for that, one would need to either fix most other dimensions (e.g., sex) or aggregate over them (e.g., via average). The selection of useful slices from the large number of possible slices is a challenge. This supports lesson Publishers may need more guidance in creating and managing slices or arbitrary groups of observations.
- Eurostat Linked Data Wrapper provides for each dataset an HTML page showing a JavaScript-based visualization of the data. This also supports lesson Consumers may need guidance in conversions into formats that can easily be displayed and further investigated in tools such as Google Data Explorer, R, Weka etc.
- One possible application would run validation checks over Eurostat data. However, the Data Cube Vocabulary is designed to publish statistical data as-is and is not intended to represent information for validation (similar to business rules).
- An application could try to automatically match elements of the geo-spatial dimension to elements of other data sources, e.g., NUTS, GADM. In Eurostat Linked Data wrapper this is done by simple URI guessing from external data sources. Automatic linking datasets or linking datasets with metadata is not part of Data Cube Vocabulary.
- The draft version of the Data Cube Vocabulary builds upon SDMX Standards Version 2.0. A newer version of SDMX, SDMX Standards, Version 2.1, is available which might be used by Eurostat in the future which supports lesson There is a putative requirement to update to SDMX 2.1 if there are specific use cases that demand it.
Publisher Case Study: Improving trust in published sustainability information at the Digital Enterprise Research Institute (DERI)
(This use case has mainly been taken from [COGS])
In several applications, relationships between statistical data need to be represented.
The goal of this use case is to describe provenance, transformations, and versioning around statistical data, so that the history of statistics published on the Web becomes clear. This may also relate to the issue of having relationships between datasets published.
A concrete example is given by Freitas et al. [COGS], where transformations on financial datasets, e.g., the addition of derived measures, conversion of units, aggregations, OLAP operations, and enrichment of statistical data are executed on statistical data before showing them in a Web-based report.
See SWPM 2012 Provenance Example for screenshots about this use case.
Benefits
Making transparent the transformation a dataset has been exposed to increases trust in the data.
Challenges
- Operations on statistical data result in new statistical data, depending on the operation. For instance, in terms of the Data Cube Vocabulary, operations such as slice, dice, roll-up, drill-down will result in new data cubes. This may require representing general relationships between cubes (as discussed in the publishing-statistical-data mailing list).
- Should the Data Cube Vocabulary support explicit declaration of such
relationships either between separated qb:DataSets or between
measures with a single
qb:DataSet(e.g.,ex:populationCountandex:populationPercent)? - If so should that be scoped to simple, common relationships like DENOM or allow expression of arbitrary mathematical relations?
- This use case opens up questions regarding versioning of statistical Linked Data. Thus, there is a possible relation to the Versioning part of GLD Best Practices Document, where it is specified how to publish data which has multiple versions.
- In this use case, the COGS vocabulary [COGS] has shown to complement the Data Cube Vocabulary with respect to representing ETL pipelines processing statistics. This supports lesson Publishers may need guidance in making transparent the pre-processing of aggregate statistics.
Consumer Case Study: Simple chart visualizations of (integrated) published climate sensor data
(Use case taken from SMART natural sciences research project)
Data that is published on the Web is typically visualized by transforming it manually into CSV or Excel and then creating a visualization on top of these formats using Excel, Tableau, RapidMiner, Rattle, Weka etc.
This use case shall demonstrate how statistical data published on the Web can be visualized inside a webpage with little effort and without using commercial or highly-complex tools.
An example scenario is environmental research done within the SMART research project. Here, statistics about environmental aspects (e.g., measurements about the climate in the Lower Jordan Valley) shall be visualized for scientists and decision makers. Statistics should also be possible to be integrated and displayed together. The data is available as XML files on the Web which are re-published as Linked Data using the Data Cube Vocabulary. On a separate website, specific parts of the data shall be queried and visualized in simple charts, e.g., line diagrams.
Figure 1: HTML embedded line chart of an environmental measure over time for three regions in the lower Jordan valley
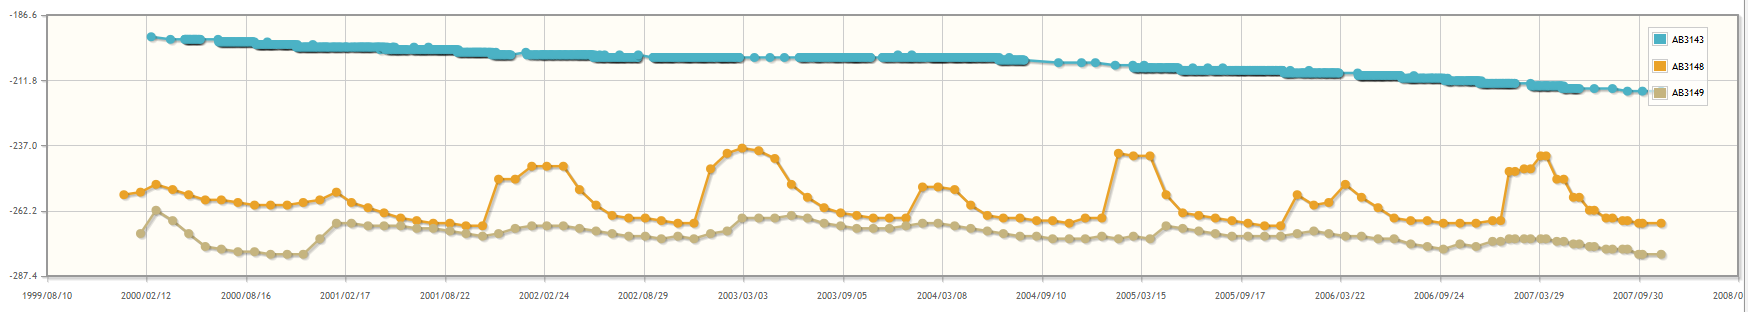
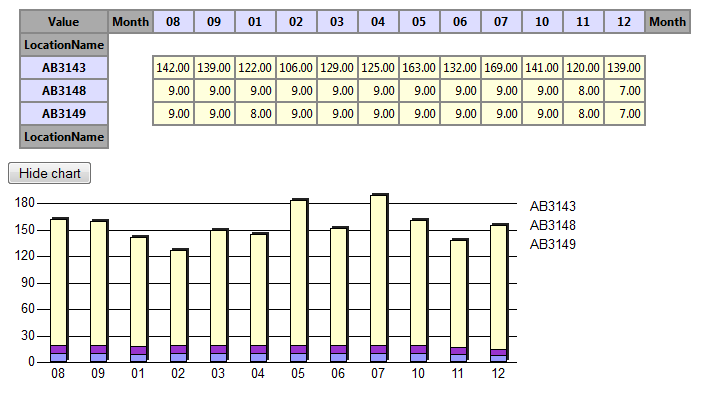
Figure 2: Showing the same data in a pivot table aggregating to single months. Here, the aggregate COUNT of measures per cell is given.
Benefits
Easy, flexible and powerful visualizations of published statistical data.
Challenges
- The difficulties lay in structuring the data appropriately so that the specific information can be queried. This supports lesson: Publishers and consumers may need guidance in checking and making use of well-formedness of published data using data cube.
- Also, data shall be published with potential integration in mind. Therefore, e.g., units of measurements need to be represented.
- Integration becomes much more difficult if publishers use different measures/dimensions.
Consumer Use Case: Visualizing published statistical data in Google Public Data Explorer
(Use case taken from Google Public Data Explorer (GPDE))
Google Public Data Explorer (GPDE) provides an easy possibility to visualize and explore statistical data. Data needs to be in the Dataset Publishing Language (DSPL) to be uploaded to the data explorer. A DSPL dataset is a bundle that contains an XML file, the schema, and a set of CSV files, the actual data. Google provides a tutorial to create a DSPL dataset from your data, e.g., in CSV. This requires a good understanding of XML, as well as a good understanding of the data that shall be visualized and explored.
In this use case, the goal is to take statistical data published as Linked Data re-using the Data Cube Vocabulary and to transform it into DSPL for visualization and exploration using GPDE with as few effort as possible.
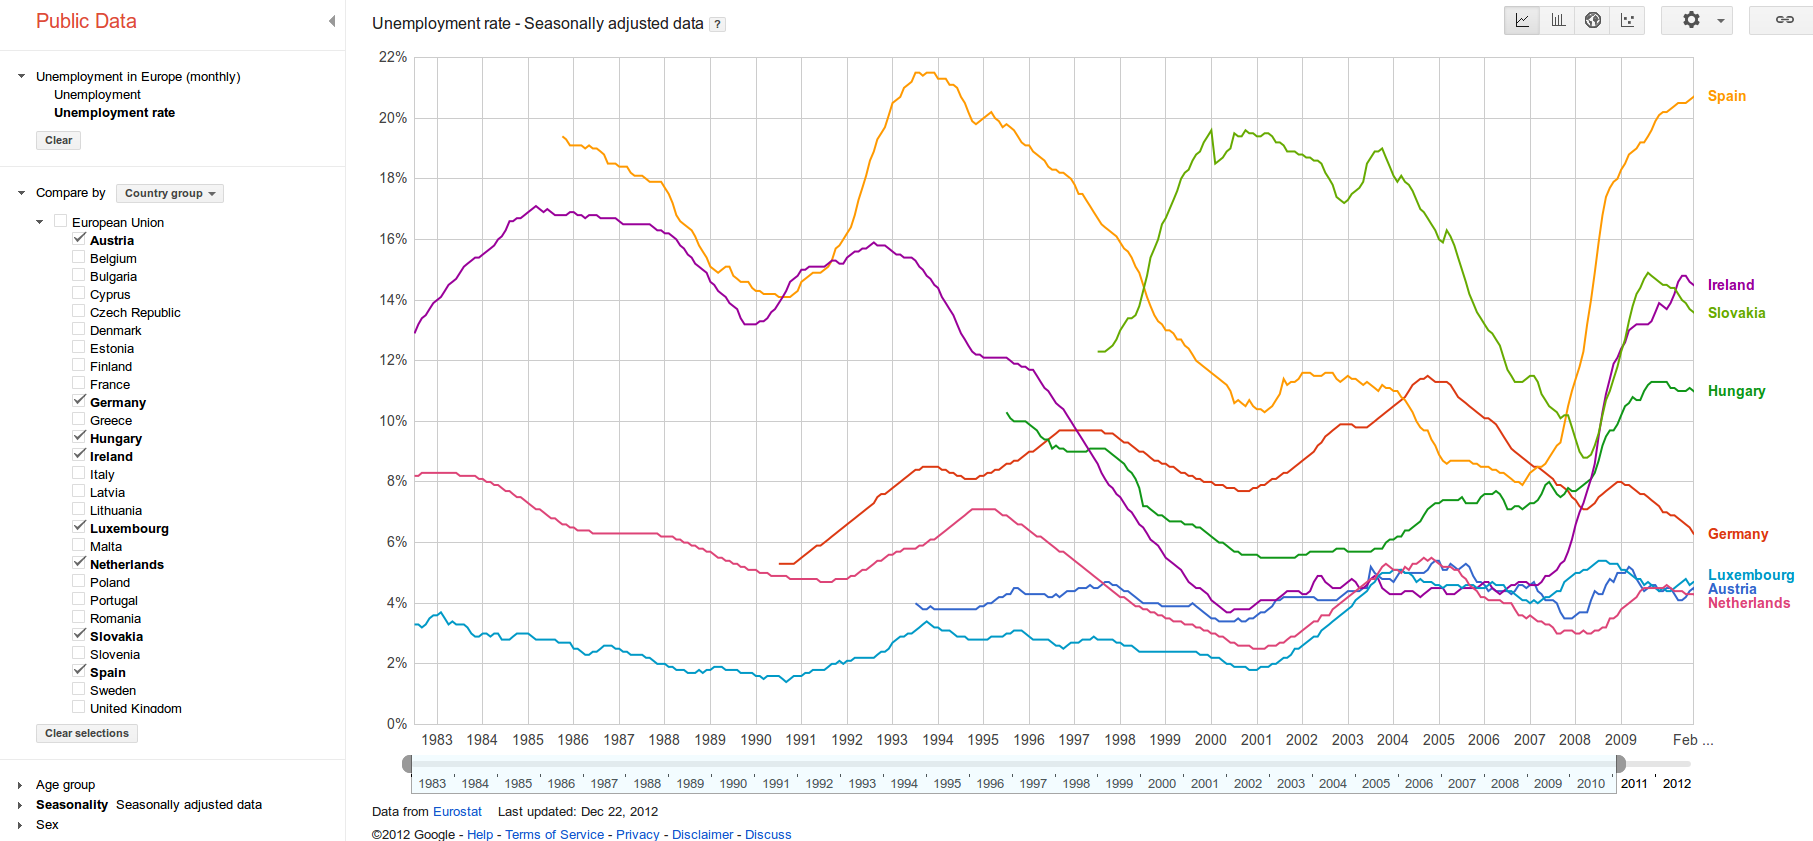
For instance, Eurostat data about Unemployment rate downloaded from the Web as shown in the following figure:
Figure 3: An interactive chart in GPDE for visualizing Eurostat data described with DSPL
There are different possible approaches each having advantages and disadvantages: 1) A customer C is downloading this data into a triple store; SPARQL queries on this data can be used to transform the data into DSPL and uploaded and visualized using GPDE. 2) or, one or more XLST transformation on the RDF/XML transforms the data into DSPL.
Benefits
- Easy to visualize statistics published using the Data Cube Vocabulary.
- There could be a process of first transforming data into RDF for further preprocessing and integration and then of loading it into GPDE for visualization.
- Linked Data could provide the way to automatically load data from a data source whereas GPDE is only for visualization.
Challenges
- The technical challenges for the consumer here lay in knowing where to download what data and how to get it transformed into DSPL without knowing the data. This supports lesson Publishers and consumers may need guidance in checking and making use of well-formedness of published data using data cube.
- Define a mapping between Data Cube and DSPL. DSPL is representative for using statistical data published on the Web in available tools for analysis. Similar tools that may additionally be covered are: Weka (arff data format), Tableau, SPSS, STATA, PC-Axis etc. This supports lesson Consumers may need guidance in conversions into formats that can easily be displayed and further investigated in tools such as Google Data Explorer, R, Weka etc..
Consumer Case Study: Analyzing published financial (XBRL) data from the SEC with common OLAP systems
(Use case taken from Financial Information Observation System (FIOS))
Online Analytical Processing (OLAP) [OLAP] is an analysis method on multidimensional data. It is an explorative analysis method that allows users to interactively view the data on different angles (rotate, select) or granularities (drill-down, roll-up), and filter it for specific information (slice, dice).
OLAP systems are commonly used in industry to analyze statistical data on a regular basis. OLAP systems first use ETL pipelines to extract-load-transform relevant data in a data warehouse and then allow interfaces to efficiently issue OLAP queries on the data.
The goal in this use case is to allow analysis of published statistical data with common OLAP systems [OLAP4LD].
For that a multidimensional model of the data needs to be generated. A multidimensional model consists of facts summarized in data cubes. Facts exhibit measures depending on members of dimensions. Members of dimensions can be further structured along hierarchies of levels.
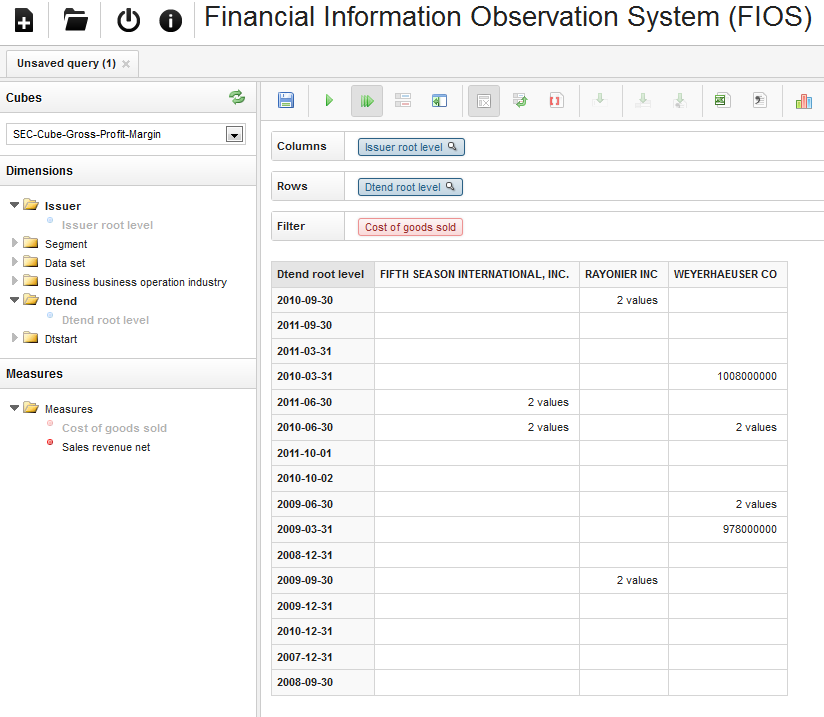
An example scenario of this use case is the Financial Information Observation System (FIOS) [FIOS], where XBRL data provided by the SEC on the Web is re-published as Linked Data and made possible to explore and analyze by stakeholders in a Web-based OLAP client Saiku.
The following figure shows an example of using FIOS. Here, for three different companies, the Cost of Goods Sold as disclosed in XBRL documents are analyzed. As cell values either the number of disclosures or — if only one available — the actual number in USD is given:
Figure 4: Example of using FIOS for OLAP operations on financial data
Benefits
- Data cube model well-known to many people in industry.
- OLAP operations cover typical business requirements, e.g., slice, dice, drill-down and can be issued via intuitive, interactive, explorative, fast OLAP frontends.
- OLAP functionality provided by many tools that may be reused
Challenges
- Define a mapping between XBRL and the Data Cube Vocabulary. XBRL is representative for other common representation formats for statistics such as CSV, Excel, ARFF, which supports lesson Publishers may need guidance in conversions from common statistical representations such as CSV, Excel, ARFF etc.
- ETL pipeline needs to automatically populate a data warehouse. Common OLAP systems use relational databases with a star schema. This supports lesson Publishers and consumers may need guidance in checking and making use of well-formedness of published data using data cube.
- A problem lies in the strict separation between queries for the structure of data (metadata queries), and queries for actual aggregated values (OLAP operations).
- Define a mapping between OLAP operations and operations on data using the Data Cube Vocabulary. This supports lesson Publishers may need guidance in how to represent common analytical operations such as Slice, Dice, Rollup on data cubes.
- Another problem lies in defining data cubes without greater insight in the data beforehand. Thus, OLAP systems have to cater for possibly missing information (e.g., the aggregation function or a human readable label).
- Depending on the expressivity of the OLAP queries (e.g., aggregation functions, hierarchies, ordering), performance plays an important role. This supports lesson Publishers and consumers may need more guidance in efficiently processing data using the Data Cube Vocabulary.
Registry Use Case: Registering published statistical data in data catalogs
(Use case motivated by Data Catalog vocabulary and RDF Data Cube Vocabulary datasets in the PlanetData Wiki)
After statistics have been published as Linked Data, the question remains how to communicate the publication and to let users discover the statistics. There are catalogs to register datasets, e.g., CKAN, datacite.org, da|ra, and Pangea. Those catalogs require specific configurations to register statistical data.
The goal of this use case is to demonstrate how to expose and distribute statistics after publication. For instance, to allow automatic registration of statistical data in such catalogs, for finding and evaluating datasets. To solve this issue, it should be possible to transform the published statistical data into formats that can be used by data catalogs.
A concrete use case is the structured collection of RDF Data Cube Vocabulary datasets in the PlanetData Wiki. This list is supposed to describe statistical datasets on a higher level — for easy discovery and selection — and to provide a useful overview of RDF Data Cube deployments in the Linked Data cloud.
Benefits
- Datasets may automatically be discovered by Web or data crawlers.
- Potential consumers will be pointed to published statistics in search engines if searching for related information.
- Users can use keyword search or structured queries for specific datasets they may be interested in.
- Applications and users are told about licenses, download capabilities etc. of datasets.
Challenges
- Define mapping between DCAT and Data Cube Vocabulary. The Data Catalog vocabulary (DCAT) is strongly related to this use case since it may complement the standard vocabulary for representing statistics in the case of registering data in a data catalog. This supports lesson Publishers may need guidance in communicating the availability of published statistical data to external parties and to allow automatic discovery of statistical data.
- Define mapping between the Data Cube Vocabulary and data catalog descriptions. If data catalogs contain statistics, they do not expose those using Linked Data but for instance using CSV, HTML (e.g., Pangea) or XML (e.g., DDI - Data Documentation Initiative). Therefore, it could also be a use case to publish such data using the Data Cube Vocabulary.