Use cases
This section presents scenarios that would be enabled by the existence of a standard vocabulary for the representation of statistics as Linked Data. Since a draft of the specification of the cube vocabulary has been published, and the vocabulary already is in use, we will call this standard vocabulary after its current name RDF Data Cube vocabulary (short [QB]) throughout the document.
We distinguish between use cases of publishing statistical data, and use cases of consuming statistical data since requirements for publishers and consumers of statistical data differ.
Publishing statistical data
Publishing general statistics in a machine-readable and application-independent way (UC 1)
More and more organizations want to publish statistics on the web, for reasons such as increasing transparency and trust. Although in the ideal case, published data can be understood by both humans and machines, data often is simply published as CSV, PDF, XSL etc., lacking elaborate metadata, which makes free usage and analysis difficult.
The goal in this use case is to use a machine-readable and application-independent description of common statistics with use of open standards. The use case is fulfilled if QB will be a Linked Data vocabulary for encoding statistical data that has a hypercube structure and as such can describe common statistics in a machine-readable and application-independent way.
An example scenario of this use case has been to publish the Combined Online Information System (COINS). There, HM Treasury, the principal custodian of financial data for the UK government, released previously restricted information from its Combined Online Information System (COINS). Five data files were released containing between 3.3 and 4.9 million rows of data. The COINS dataset was translated into RDF for two reasons:
- To publish statistics (e.g., as data files) are too large to load into widely available analysis tools such as Microsoft Excel, a common tool-of-choice for many data investigators.
- COINS is a highly technical information source, requiring both domain and technical skills to make useful applications around the data.
Publishing statistics is challenging for the several reasons:
Representing observations and measurements requires more complex modeling as discussed by Martin Fowler [Fowler, 1997]: Recording a statistic simply as an attribute to an object (e.g., a the fact that a person weighs 185 pounds) fails with representing important concepts such as quantity, measurement, and observation.
Quantity comprises necessary information to interpret the value, e.g., the unit and arithmetical and comparative operations; humans and machines can appropriately visualize such quantities or have conversions between different quantities.
Quantity comprises necessary information to interpret the value, e.g., the unit and arithmetical and comparative operations; humans and machines can appropriately visualize such quantities or have conversions between different quantities.
A Measurement separates a quantity from the actual event at which it was collected; a measurement assigns a quantity to a specific phenomenon type (e.g., strength). Also, a measurement can record metadata such as who did the measurement (person), and when was it done (time).
Observations, eventually, abstract from measurements only recording numeric quantities. An Observation can also assign a category observation (e.g., blood group A) to an observation. Figure demonstrates this relationship.
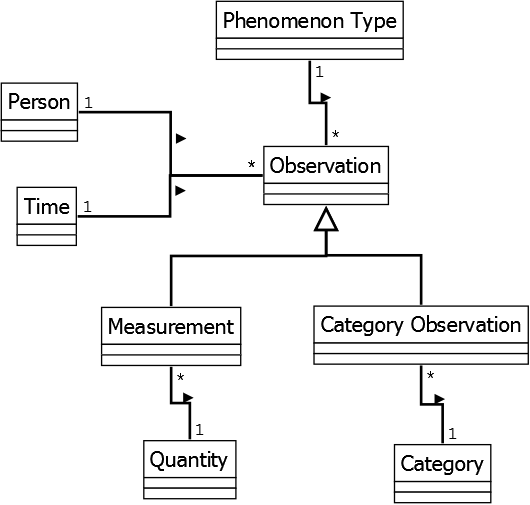
QB deploys the multidimensional model (made of observations with Measures depending on Dimensions and Dimension Members, and further contextualized by Attributes) and should cater for these complexity in modelling.
Another challenge is that for brevity reasons and to avoid repetition, it is useful to have abbreviation mechanisms such as assigning overall valid properties of observations at the dataset or slice level, and become implicitly part of each observation. For instance, in the case of COINS, all of the values are in thousands of pounds sterling. However, one of the use cases for the linked data version of COINS is to allow others to link to individual observations, which suggests that these observations should be standalone and self-contained – and should therefore have explicit multipliers and units on each observation. One suggestion is to author data without the duplication, but have the data publication tools "flatten" the compact representation into standalone observations during the publication process.
A further challenge is related to slices of data. Slices of data group observations that are of special interest, e.g., slices unemployment rates per year of a specific gender are suitable for direct visualization in a line diagram. However, depending on the number of Dimensions, the number of possible slices can become large which makes it difficult to select all interesting slices. Therefore, and because of their additional complexity, not many publishers create slices. In fact, it is somewhat unclear at this point which slices through the data will be useful to (COINS-RDF) users.
Unanticipated Uses (optional): -
Existing Work (optional): -
Publishing one or many MS excel spreadsheet files with statistical data on the web (UC 2)
Not only in government, there is a need to publish considerable amounts of statistical data to be consumed in various (also unexpected) application scenarios. Typically, Microsoft Excel sheets are made available for download. Those excel sheets contain single spreadsheets with several multidimensional data tables, having a name and notes, as well as column values, row values, and cell values.
The goal in this use case is to to publish spreadsheet information in a machine-readable format on the web, e.g., so that crawlers can find spreadsheets that use a certain column value. The published data should represent and make available for queries the most important information in the spreadsheets, e.g., rows, columns, and cell values. QB should provide the level of detail that is needed for such a transformation in order to fulfil this use case.
In a possible use case scenario an institution wants to develop or use a software that transforms their excel sheets into the appropriate format.
@@TODO: Concrete example needed.
Challenges of this use case are:
- Excel sheets provide much flexibility in arranging information. It may be necessary to limit this flexibility to allow automatic transformation.
- There may be many spreadsheets.
- Semi-structured information, e.g., notes about lineage of data cells, may not be possible to be formalized.
Unanticipated Uses (optional): -
Existing Work (optional): Stats2RDF uses OntoWiki to translate CSV into QB [Stats2RDF].
Publishing SDMX as Linked Data (UC 3)
The ISO standard for exchanging and sharing statistical data and metadata among organizations is Statistical Data and Metadata eXchange (SDMX). Since this standard has proven applicable in many contexts, QB is designed to be compatible with the multidimensional model that underlies SDMX.
@@TODO: The QB spec should maybe also use the term "multidimensional model" instead of the less clear "cube model" term.
Therefore, it should be possible to re-publish SDMX data using QB.
The scenario for this use case is Eurostat [EUROSTAT], which publishes large amounts of European statistics coming from a data warehouse as SDMX and other formats on the web. Eurostat also provides an interface to browse and explore the datasets. However, linking such multidimensional data to related data sets and concepts would require download of interesting datasets and manual integration.
The goal of this use case is to improve integration with other datasets; Eurostat data should be published on the web in a machine-readable format, possible to be linked with other datasets, and possible to be freeley consumed by applications. This use case is fulfilled if QB can be used for publishing the data from Eurostat as Linked Data for integration.
A publisher wants to make available Eurostat data as Linked Data. The statistical data shall be published as is. It is not necessary to represent information for validation. Data is read from tsv only. There are two concrete examples of this use case: Eurostat Linked Data Wrapper (http://estatwrap.ontologycentral.com/), and Linked Statistics Eurostat Data (http://eurostat.linked-statistics.org/). They have slightly different focus (e.g., with respect to completeness, performance, and agility).
Challenges of this use case are:
- There are large amounts of SDMX data; the Eurostat dataset comprises 350 GB of data. This may influence decisions about toolsets and architectures to use. One important task is to decide whether to structure the data in separate datasets.
- Again, the question comes up whether slices are useful.
Unanticipated Uses (optional): -
Existing Work (optional): -
Publishing sensor data as statistics (UC 4)
Typically, multidimensional data is aggregated. However, there are cases where non-aggregated data needs to be published, e.g., observational, sensor network and forecast data sets. Such raw data may be available in RDF, already, but using a different vocabulary.
The goal of this use case is to demonstrate that publishing of aggregate values or of raw data should not make much of a difference in QB.
For example the Environment Agency uses it to publish (at least weekly) information on the quality of bathing waters around England and Wales [EnvAge]. In another scenario DERI tracks from measurements about printing for a sustainability report. In the DERI scenario, raw data (number of printouts per person) is collected, then aggregated on a unit level, and then modelled using QB.
Problems and Limitations:
- This use case also shall demonstrate how to link statistics with other statistics or non-statistical data (metadata).
Unanticipated Uses (optional): -
Existing Work (optional): Semantic Sensor Network ontology [SSN] already provides a way to publish sensor information. SSN data provides statistical Linked Data and grounds its data to the domain, e.g., sensors that collect observations (e.g., sensors measuring average of temperature over location and time). A number of organizations, particularly in the Climate and Meteorological area already have some commitment to the OGC "Observations and Measurements" (O&M) logical data model, also published as ISO 19156. The QB spec should maybe also prefer the term "multidimensional model" instead of the less clear "cube model" term.
@@TODO: Are there any statements about compatibility and interoperability between O&M and Data Cube that can be made to give guidance to such organizations?
Registering statistical data in dataset catalogs (UC 5)
After statistics have been published as Linked Data, the question remains how to communicate the publication and let users find the statistics. There are catalogs to register datasets, e.g., CKAN, datacite.org, da|ra, and Pangea. Those catalogs require specific configurations to register statistical data.
The goal of this use case is to demonstrate how to expose and distribute statistics after modeling using QB. For instance, to allow automatic registration of statistical data in such catalogs, for finding and evaluating datasets. To solve this issue, it should be possible to transform QB data into formats that can be used by data catalogs.
@@TODO: Find specific use case scenario or ask how other publishers of QB data have dealt with this issue Maybe relation to DCAT?
Problems and Limitations: -
Unanticipated Uses (optional): If data catalogs contain statistics, they do not expose those using Linked Data but for instance using CSV or HTML (Pangea [11]). It could also be a use case to publish such data using QB.
Existing Work (optional): -
Making transparent transformations on or different versions of statistical data (UC 6)
Statistical data often is used and further transformed for analysis and reporting. There is the risk that data has been incorrectly transformed so that the result is not interpretable any more. Therefore, if statistical data has been derived from other statistical data, this should be made transparent.
The goal of this use case is to describe provenance and versioning around statistical data, so that the history of statistics published on the web becomes clear. This may also relate to the issue of having relationships between datasets published using QB. To fulfil this use case QB should recommend specific approaches to transforming and deriving of datasets which can be tracked and stored with the statistical data.
@@TODO: Add concrete example use case scenario.
Challenges of this use case are:
- Operations on statistical data result in new statistical data, depending on the operation. For intance, in terms of Data Cube, operations such as slice, dice, roll-up, drill-down will result in new Data Cubes. This may require representing general relationships between cubes (as discussed here: [12]).
Unanticipated Uses (optional): -
Existing Work (optional): Possible relation to Best Practices part on Versioning [13], where it is specified how to publish data which has multiple versions.
Consuming published statistical data
Simple chart visualizations of (integrated) published statistical datasets (UC 7)
Data that is published on the Web is typically visualized by transforming it manually into CSV or Excel and then creating a visualization on top of these formats using Excel, Tableau, RapidMiner, Rattle, Weka etc.
This use case shall demonstrate how statistical data published on the web can be directly visualized, without using commercial or highly-complex tools. This use case is fulfilled if data that is published in QB can be directly visualized inside a webpage.
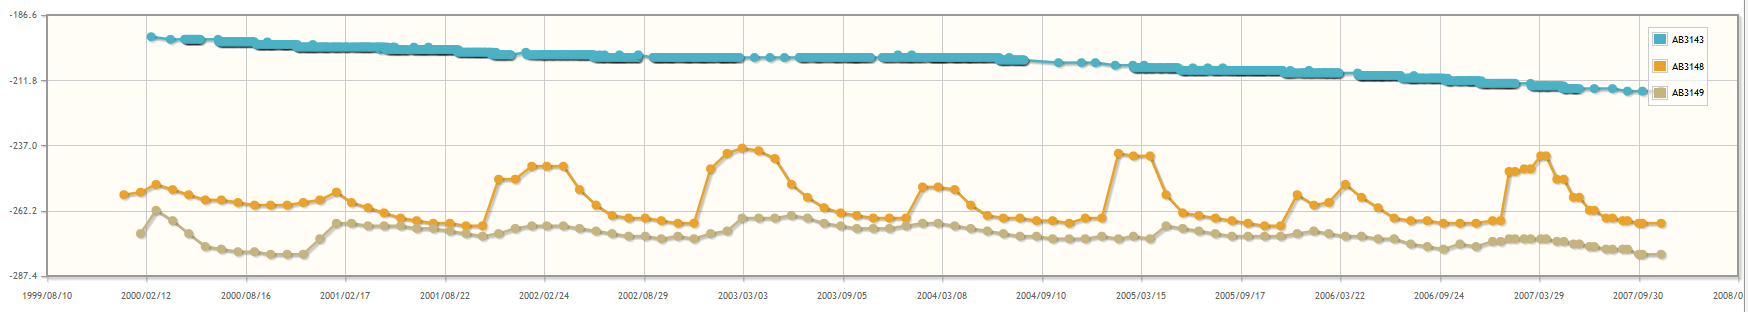
An example scenario is environmental research done within the SMART research project (http://www.iwrm-smart.org/). Here, statistics about environmental aspects (e.g., measurements about the climate in the Lower Jordan Valley) shall be visualized for scientists and decision makers. Statistics should also be possible to be integrated and displayed together. The data is available as XML files on the web. On a separate website, specific parts of the data shall be queried and visualized in simple charts, e.g., line diagrams. The following figure shows the wanted display of an environmental measure over time for three regions in the lower Jordan valley; displayed inside a web page:
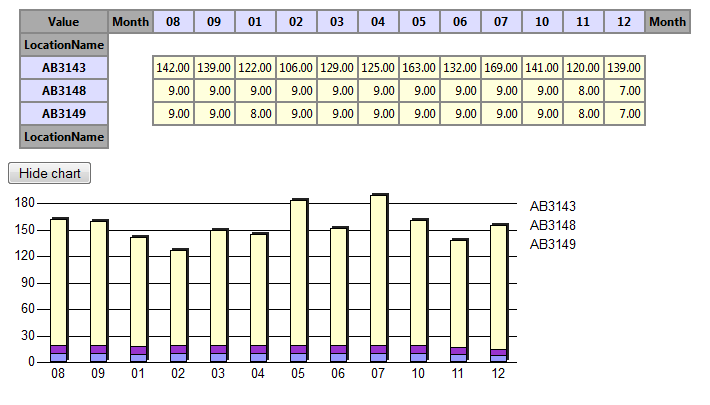
The following figure shows the same measures in a pivot table. Here, the aggregate COUNT of measures per cell is given.
The use case uses Google App Engine, Qcrumb.com, and Spark. An example of a line diagram is given at [14] (some loading time needed). Current work tries to integrate current datasets with additional data sources, and then having queries that take data from both datasets and display them together.
Challenges of this use case are:
- The difficulties lay in structuring the data appropriately so that the specific information can be queried.
- Also, data shall be published with having potential integration in mind. Therefore, e.g., units of measurements need to be represented.
- Integration becomes much more difficult if publishers use different measures, dimensions.
Unanticipated Uses (optional): -
Existing Work (optional): -
Uploading published statistical data in Google Public Data Explorer (UC 8)
Google Public Data Explorer (GPDE - http://code.google.com/apis/publicdata/) provides an easy possibility to visualize and explore statistical data. Data needs to be in the Dataset Publishing Language (DSPL - https://developers.google.com/public-data/overview) to be uploaded to the data explorer. A DSPL dataset is a bundle that contains an XML file, the schema, and a set of CSV files, the actual data. Google provides a tutorial to create a DSPL dataset from your data, e.g., in CSV. This requires a good understanding of XML, as well as a good understanding of the data that shall be visualized and explored.
In this use case, it shall be demonstrate how to take any published QB dataset and to transform it automatically into DSPL for visualization and exploration. A dataset that is published conforming to QB will provide the level of detail that is needed for such a transformation.
In an example scenario, a publisher P has published data using QB. There are two different ways to fulfil this use case: 1) A customer C is downloading this data into a triple store; SPARQL queries on this data can be used to transform the data into DSPL and uploaded and visualized using GPDE. 2) or, one or more XLST transformation on the RDF/XML transforms the data into DSPL.
Challenges of this use case are:
- The technical challenges for the consumer here lay in knowing where to download what data and how to get it transformed into DSPL without knowing the data.
Unanticipated Uses (optional): DSPL is representative for using statistical data published on the web in available tools for analysis. Similar tools that may be automatically covered are: Weka (arff data format), Tableau, etc.
Existing Work (optional): -
Unanticipated Uses (optional): -
Existing Work (optional): -
Allow Online Analytical Processing on published datasets of statistical data (UC 9)
Online Analytical Processing [15] is an analysis method on multidimensional data. It is an explorative analysis methode that allows users to interactively view the data on different angles (rotate, select) or granularities (drill-down, roll-up), and filter it for specific information (slice, dice).
The multidimensional model used in QB to model statistics should be usable by OLAP systems. More specifically, data that conforms to QB can be used to define a Data Cube within an OLAP engine and can then be queries by OLAP clients.
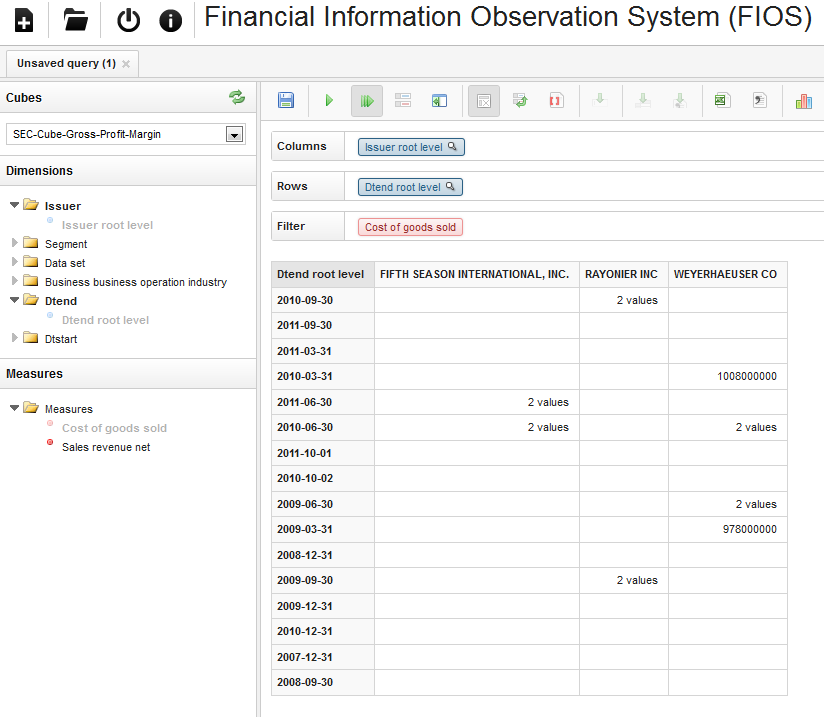
An example scenario of this use case is the Financial Information Observation System (FIOS) [16], where XBRL data has been re-published using QB and made analysable for stakeholders in a web-based OLAP client. The following figure shows an example of using FIOS. Here, for three different companies, cost of goods sold as disclosed in XBRL documents are analysed. As cell values either the number of disclosures or - if only one available - the actual number in USD is given:
Challenges of this use case are:
- A problem lies in the strict separation between queries for the structure of data, and queries for actual aggregated values.
- Another problem lies in defining Data Cubes without greater insight in the data beforehand.
- Depending on the expressivity of the OLAP queries (e.g., aggregation functions, hierarchies, ordering), performance plays an important role.
- QB allows flexibility in describing statistics, e.g., in order to reduce redundancy of information in single observations. These alternatives make general consumption of QB data more complex. Also, it is not clear, what "conforms" to QB means, e.g., is a qb:DataStructureDefinition required?
Unanticipated Uses (optional): -
Existing Work (optional): -
Unanticipated Uses (optional): -
Existing Work (optional): -
Transforming published statistics into XBRL (UC 10)
XBRL is a standard data format for disclosing financial information. Typically, financial data is not managed within the organization using XBRL but instead, internal formats such as excel or relational databases are used. If different data sources are to be summarized in XBRL data formats to be published, an internally-used standard format such as QB could help integrate and transform the data into the appropriate format.
In this use case data that is available as data conforming to QB should also be possible to be automatically transformed into such XBRL data format. This use case is fulfilled if QB contains necessary information to derive XBRL data.
In an example scenario, DERI has had a use case to publish sustainable IT information as XBRL to the Global Reporting Initiative (GRI - https://www.globalreporting.org/). Here, raw data (number of printouts per person) is collected, then aggregated on a unit level and modelled using QB. QB data shall then be used directly to fill-in XBRL documents that can be published to the GRI.
Challenges of this use case are:
- So far, QB data has been transformed into semantic XBRL, a vocabulary closer to XBRL. There is the chance that certain information required in a GRI XBRL document cannot be encoded using a vocabulary as general as QB. In this case, QB could be used in concordance with semantic XBRL.
@@TODO: Add link to semantic XBRL.
Unanticipated Uses (optional): -
Existing Work (optional): -